
Monitor Progress
Producing an educated, tested understanding of your team's progress and velocity can ensure you're delivering apps and features on time, all while making efficient use of your team's productivity efforts.
The more accurate the tracking, the easier the sprints are to plan and the future is to predict. Much of accurate tracking depends on the tracking tools you use and the team's input/reporting behaviours.
What Jira can't show you
Using Jira's tracking tools, you can plan and determine how much work your team can commit to in a sprint by estimating efforts in sprint planning. Once the sprint starts, each team member can log the actual time spent working on those tasks, which allows you to view feedback in two significant ways.
Measure team capacity using time so you can accurately estimate how much work is being committed to a sprint.
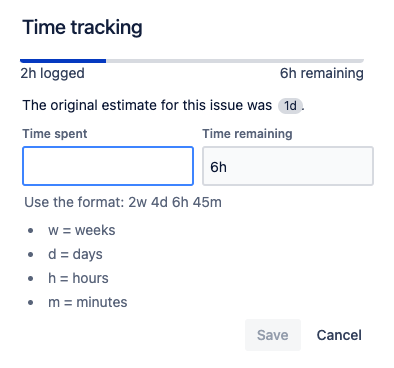
Monitor progress by tracking the time it takes to deliver a specific task. Note: The time it takes to complete a task may differ from the original estimation given during sprint planning.
However, tracking individual tasks doesn't give you a complete picture of the entire project's progress. Sure, you can measure the sprint health via burndown/burnup charts, but what if your project spans multiple sprints and you need to report on the overall completion rate to your stakeholders?
Need to forecast your sprint velocity with more reliable data? You'd need to evaluate the total time spent to complete the sprint against the original estimate and make adjustments in subsequent sprints. And it requires a lot of manual work to extract those insights from the existing reports in Jira.
Improve progress monitoring with Hierarchy for Jira
Hierarchy for Jira gives you instantaneous status updates on issue progress and constantly measures your team's velocity so you can accurately estimate completion and delivery dates with greater accuracy. For example, you can measure the current sprint completion status in two useful ways depending on your Estimate Type preferences:
Estimation options: Roll-up versus Sum-up
Hierarchy for Jira offers you two ways to view the estimation details for your project: the Roll-up view and the Sum-up view.
To illustrate the differences between these two options, see the following examples:
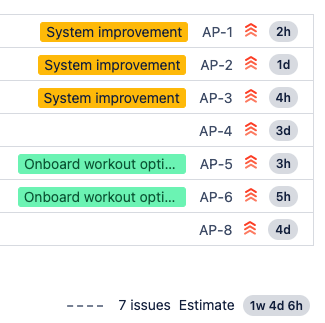
Roll-up values
If a parent issue has no story-point value assigned, Hierarchy for Jira totals the story points from all of the child issues directly below it and adds that total number of story points to the parent issue. If a parent issue has an assigned story-point value, Hierarchy for Jira takes no action
- Sum-up values
The story-point sum for parent and child issues, which appears on the parent issue.
The impact of filters
Roll-up and Sum-up values for both story-point and time estimates are calculated based on view parameters. If a filter is applied to hide issues, those filtered/hidden issues are not included in Roll-up or Sum-up values.
Progress against Current Estimate
Using this report, you can view the sprint's completion status by comparing progress against the Current Estimate.
The values used to calculate this report are:
In the example shown, you can see that the Current estimate progress is 66%, and you can also see how specific issues are progressing against their current estimates.

Progress against Original Estimate
Using this report, you can view the sprint's completion status by comparing progress against the Original Estimate.
The values used to calculate this report are:
- Original estimate = Field available from Jira.
In the example shown, you can see that the Original estimate progress is 83%, and you can also see how specific issues are progressing against their original estimates.

See the big picture
Using the custom hierarchy function allows you to visualise a complete project in your preferred order, from high-level initiatives to individual tasks. You can view the progress of a project using story points and/or time tracking.
For example, based on the sample project view in the following image, you can confidently say, "Version 2.1 is expected to be delivered in about a week."

Issue progress report
Adding the issue progress report column to your hierarchy tree view gives you a quick and easy way to get an overview of the progress of different issues. This is especially useful for parent issues. The progress bar in this column shows the percentage of completed child issues.
The colours displayed are:
- Grey represents "To Do"
- Blue represents "In Progress"
- Green represents "Done"
In the example below, the parent issue is 25% complete, with one of the four child issues is complete, one in progress, and 2 remaining as to do.