Chart Visualizations
Summary Tab
To access our integrated data visualizations, click your desired Form from the Forms Homepage.
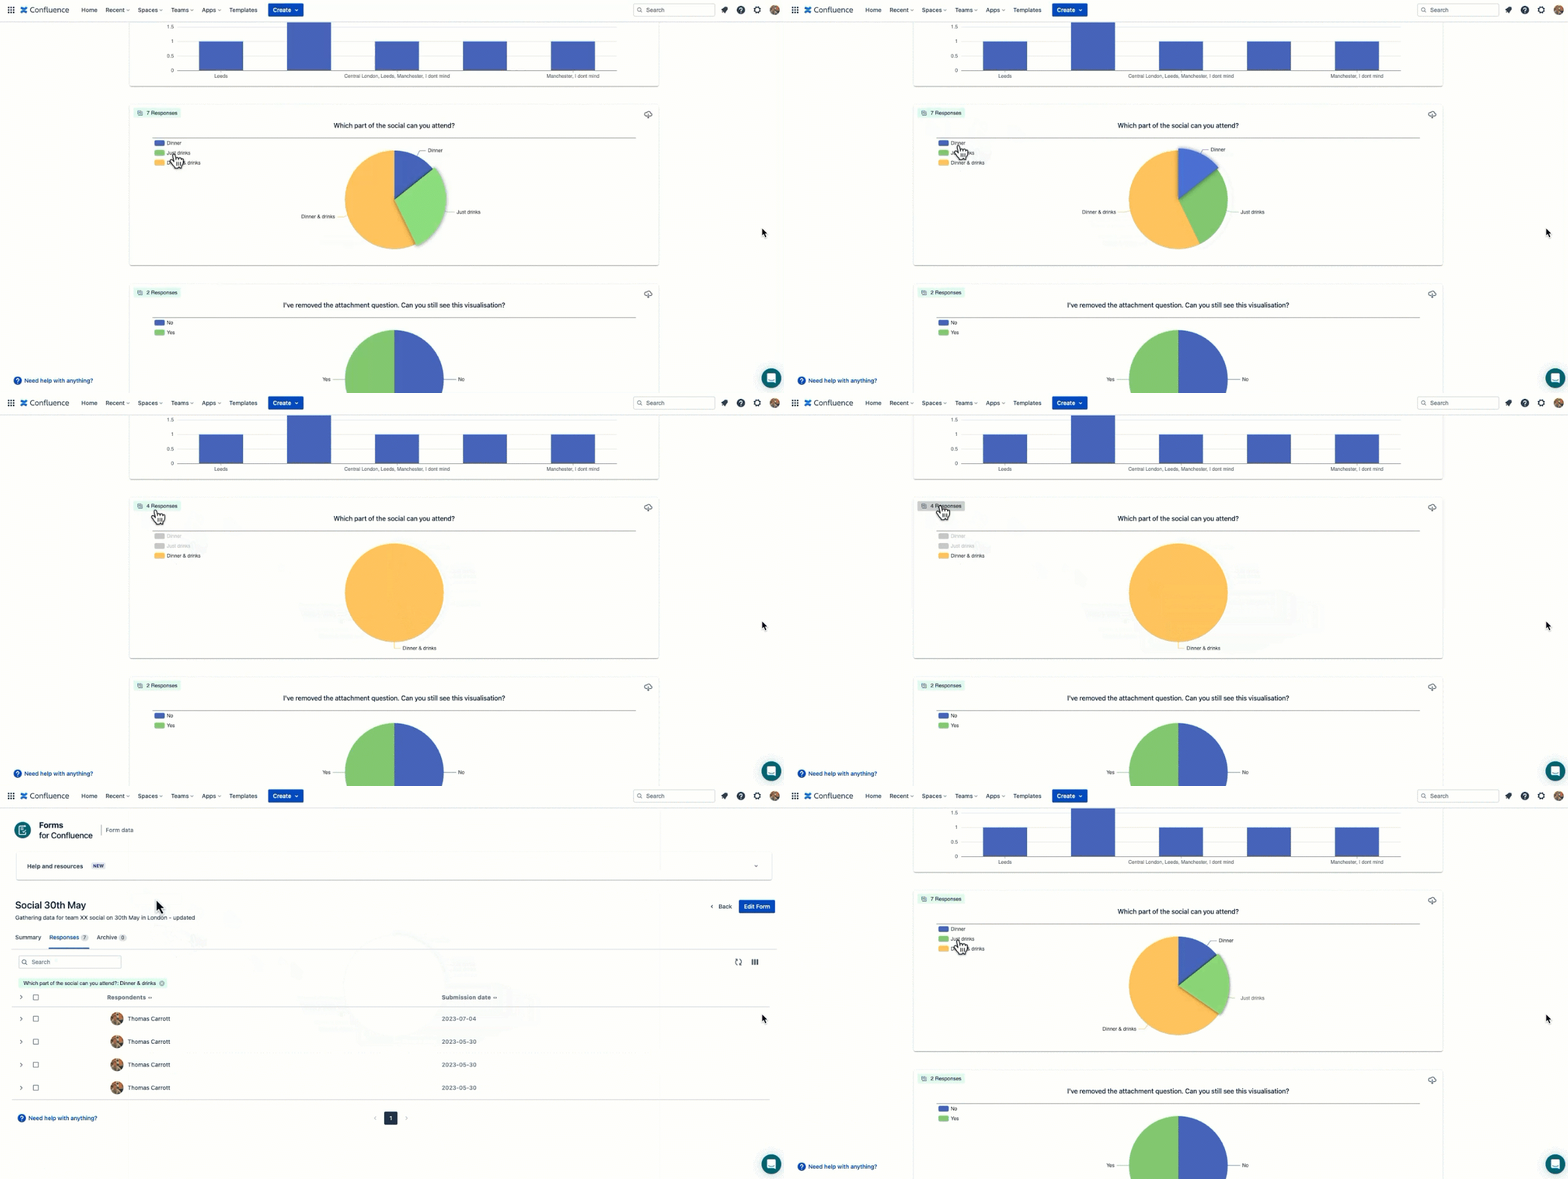
The form data opens in the Summary tab, which contains effective ways to understand the dataset.
View and interact
The Summary tab contains several interactive charts and graphs containing live response data from your desired form.
These visualizations are designed to help you understand the responses from your dataset efficiently.
Use the cursor to interact and filter data with any visualization, as desired.
Filter responses in charts and graphs and click to interact with that filtered data in the responses table via the Responses button in the top left.
Page embedded visualizations
Editable chart visualizations can be embedded within a Confluence page. Select one or more questions to show an interactive, hoverable chart on your chosen page.
Charts may be embedded directly on a page or via the Summary tab.
Embed a chart from a Confluence page
- Open your desired Forms for Confluence Cloud page in Edit mode.
- Use the / command and type
Embed visualizations.- Select the Embed visualizations | Forms for Confluence option.
The Embed visualizations macro opens.
- Select the Embed visualizations | Forms for Confluence option.
- Select your desired form in the Form Name dropdown option.
- Optional: Use the Show form title on the page checkbox option.
- Optional: Choose to display All or Specific questions in the What to visualize section.
- Select which question(s) to display.
- Click the Proceed option.
The window closes, and the chart appears on the Confluence page.
Embed a chart from the Summary tab
- From the Summary tab of a desired form, select the Add to page option in the upper left corner.
The Add Visualization to Page pop-up appears. - Select your desired Space, Parent Page, and Page Title for the visualization.
The Embed visualizations macro opens. - Select your desired form in the Form Name dropdown option.
- Optional: Use the Show form title on the page checkbox option.
- Optional: Choose to display All or Specific questions in the What to visualize section.
- Select which question(s) to display.
- Click the Proceed option.
The window closes, and the chart appears on the Confluence page.


