Execution History
Understanding the effects of ScriptRunner scripts on your Jira instance is critical for successful platform management. Use Execution History to view execution times and failure rates of ScriptRunner scripts in your instance, providing in-depth data and logs for script executions.
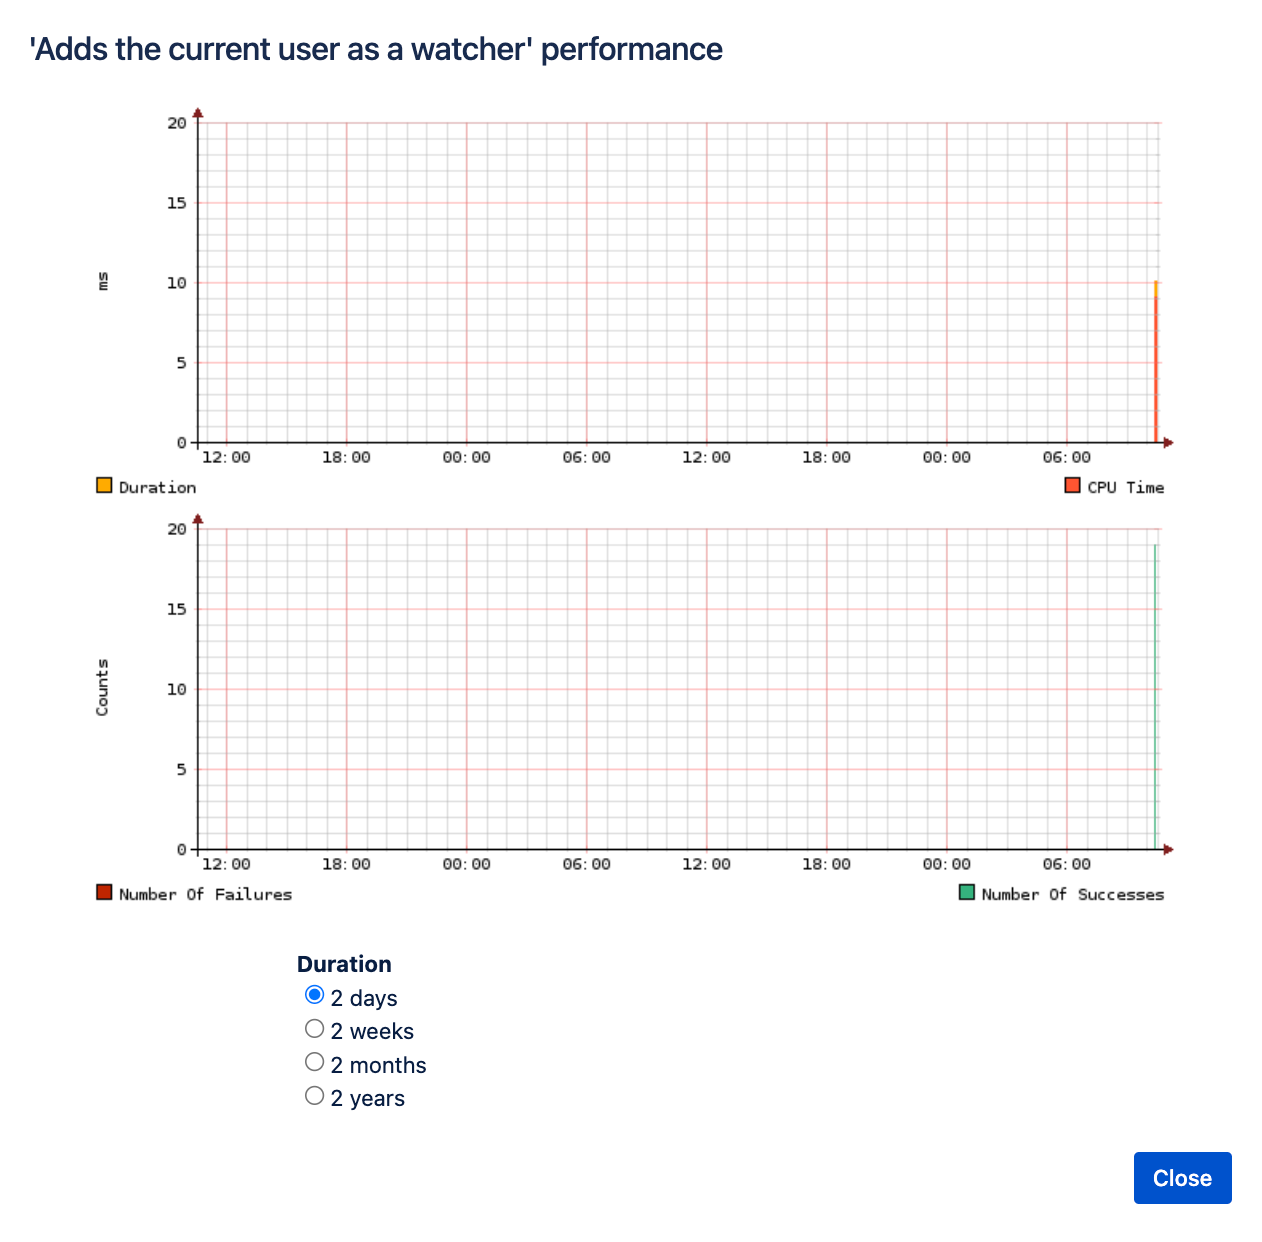
Using the Performance column, observe if a script is getting slower over time, or if slow performance correlates with specific events (such as Jira or app upgrades). Execution History and Performance provide long-term analytics, up to two years, allowing you to develop scripts and change execution timings, to keep your instance performing at an optimal level.
You can view the execution history and performance of the following:
- Scripted listeners
- Scheduled jobs
- Escalation services
- Post functions
- JQL functions
Viewing the execution history of your ScriptRunner script
Navigate to the script location in ScriptRunner. For example, to view the execution history of a job, navigate to Jobs.
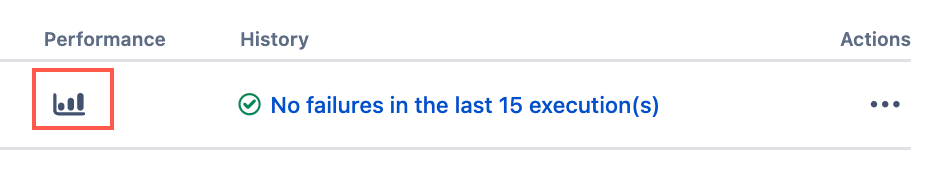
Select the text under the History column, and the Execution Information window appears.

Select the success (green checkmark) or failure (red X) symbol to view each execution. The Execution History window shows in-depth data and logs for each script execution.
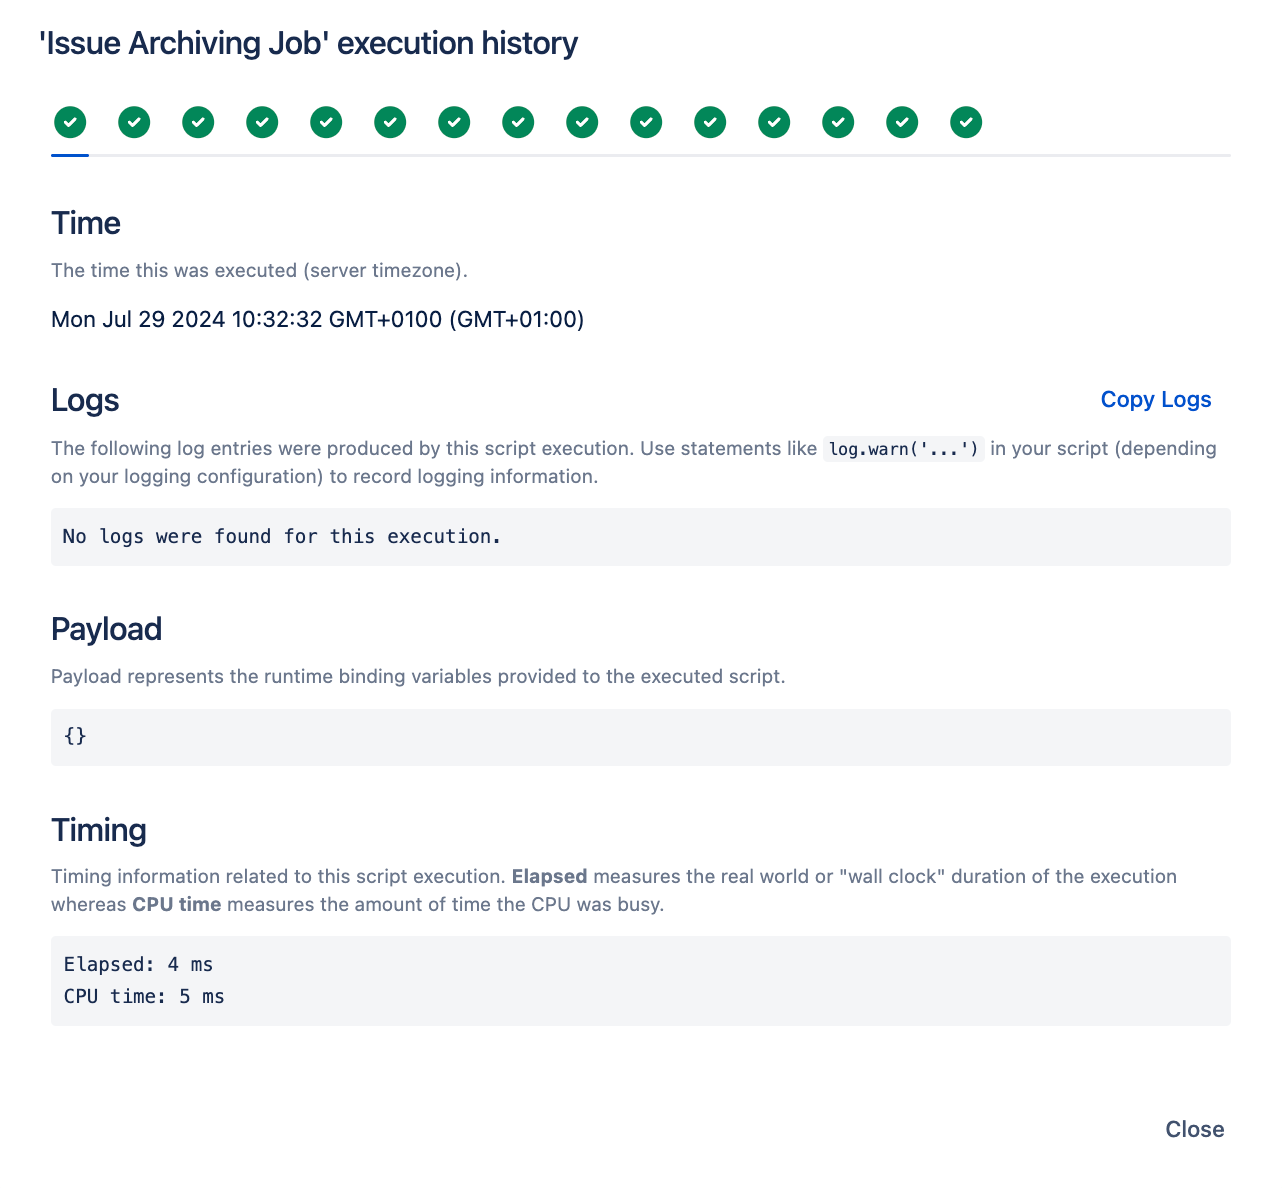
Execution Information has four sections:
- Time - Time the task was executed.
Logs - Displays log information for the specific execution.
Payload - Data sent when the script executed.
Timing - Time taken for the script to execute, including Elapsed and CPU Time.
Viewing performance history
An execution history graph for the script shows Duration and Node data. To see this information, proceed as follows:
- Navigate to the script location. For example, to view the performance history of a job, navigate to Jobs.
- Select the Performance icon.
Select the Duration options to change the scale of the x-axis.
You have the option of selecting 2 days, 2 weeks, 2 months or two years.
If you have ScriptRunner for Jira Data Center, you can select the Node option to switch between nodes.