
Logging
Logging and Profiling
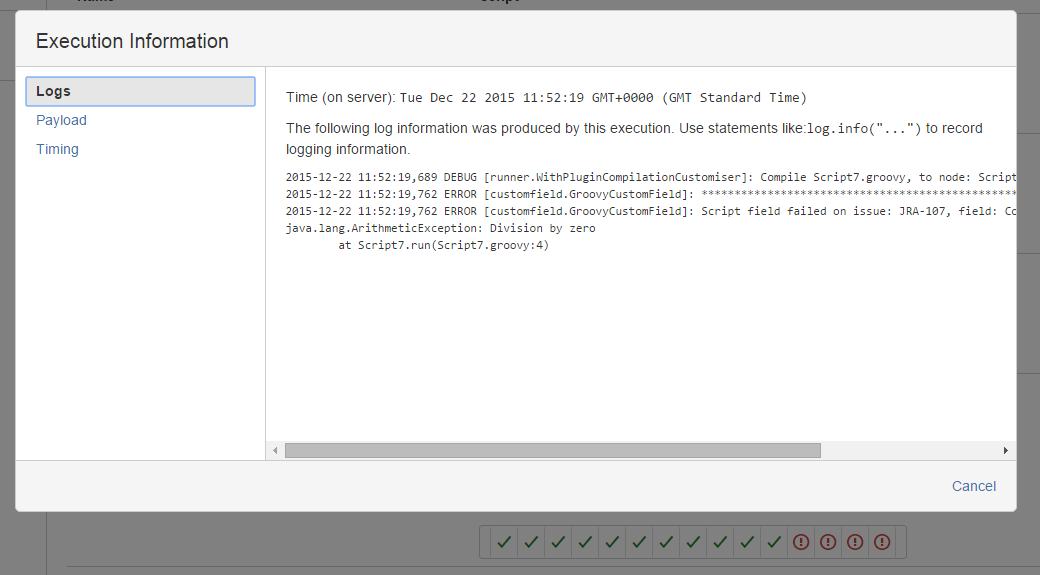
Each execution of any of your scripts are recorded. We record:
any parameters passed to it (the script binding), which is known as the payload
the log output including any exception message, if present
timing information, which is the total elapsed time, and the CPU time used
The last 15 executions are displayed where relevant, eg when viewing workflows, script fields, script listeners, and REST endpoints administration.
A summary of recent history is displayed, eg

Clicking through on any of these will give you further information about that particular invocation.

This is most useful for viewing why your own scripts failed, particularly if it’s an intermittent failure, which may only happen because of certain issue attributes - for instance a field value being unexpectedly null.
Only uncaught exceptions are shown as failures.
On Jira shutdown the last 15 invocations of each function are written to the database so that they persist a restart.
Known Issues
Uncaught exceptions in conditions or additional code are not displayed as errors, but the error will appear in the logs
When using Jira Data Center, only invocations that executed on that node are shown. If using Data Center, and you suspect issues on just one node, you will need to open the corresponding URL on that DC instance
Certain categories of scripts are currently excluded from log captures, namely JQL functions and administration scripts (built-in scripts)
On Jira 6.x the persistence functionality may not always work