Included JQL Functions
There are a large number of included functions, documented below.
Some functions require reindexing
You will need to reindex before you can use the following functions:
hasComments
lastComment
hasAttachments
fileAttached
workLogged (if prior to Jira 6.4)
linkedIssuesOfRemote
A background reindex will be fine.
Function name clashes with other Plugins
Some other plugins may provide functions with the same name as those provided by ScriptRunner, eg hasAttachments. For functions like these, no other name would make a great deal of sense, so this is not surprising.
The rules for when that happens are explained in JRA-24219, i.e, the plugin key that is first alphabetically will "win". As the other plugin is generally "JQL Tricks", whose key is before ScriptRunner’s, functions from that plugin are normally registered over ScriptRunner’s.
If you want to use both plugins, go to "Manage Plugins", then expand the modules for either plugin, and selectively enable or disable the JQL function modules for those functions. For example, in ScriptRunner, the module providing hasAttachment is displayed as:
Performance
All the functions have been tested on real-world instances with greater than five hundred thousand issues, and most execute in well under one second. Where that is not the case, the performance characteristics are documented.
Some functions take a subquery as a first parameter to narrow down the number of issues that will be checked. You should enter terms here to restrict the number of issues the function will operate on. The performance of a query will be proportional to the number of issues that are returned by the subquery. Some functions filter these further to issues that have the relevant field(s) non-empty.
Taking an example, if you are only interested in issues that have ABC<four digit number> in the description, that are assigned to me, the first of these two will be faster:
issueFunction in issueFieldMatch("assignee = currentUser()", "description", "ABC\\d{4}")
assignee = currentUser() and issueFunction in issueFieldMatch("", "description", "ABC\\d{4}")
Using a project clause outside the query parameter will behave the same as if you had used it within the parameter (new in 4.3.5). So the following two queries will have the same performance:
issueFunction in parentsOf("project = FOO")
project = FOO and issueFunction in parentsOf("")
Slow Log
Any ScriptRunner provided function that takes greater than one second will log to atlassian-jira-slow-queries.log. Note that we log when a particular clause is slow, not for the entire query, which we do not have access to.
In this case you will see something like the following in the slow query log:
2016-07-14 15:26:23,208 http-bio-8080-exec-3 INFO admin 926x1041x2 yi0om0 /rest/issueNav/1/issueTable [c.a.j.i.search.providers.LuceneSearchProvider_SLOW] ScriptRunner JQL function 'slowFunction' with clause '{issueFunction in slowFunction()}' took '2390' ms to run.
Query Timeouts
When any query that takes longer than one minute is run in the issue navigator by pressing the Run button, no results are displayed, and there is no indication that it timed out. However, if you do a full page refresh, it will wait as long as it takes (notwithstanding your reverse proxy may time out). This is a Jira behaviour, not ScriptRunner.
By default we will time out any ScriptRunner function that takes more than one minute. This is to avoid the case where long-running queries continue to run in the background, even after the browser has timed out. If this happens it will be logged in the slow query log, with a warning that the function was killed.
To retain the old behaviour, set system property sr.jql.timeout=0. (See how).
To customize the timeout, set sr.jql.timeout to the number of milliseconds after which it should timeout, eg for two minutes set -Dsr.jql.timeout=120000.
Note that it may not time out immediately after the configured value, but it should happen shortly thereafter.
Query Profiler
For administrators only, there is a facility to profile JQL to find poorly-performing queries. This simply surfaces information that is otherwise buried in log files, and somewhat simplifies it.
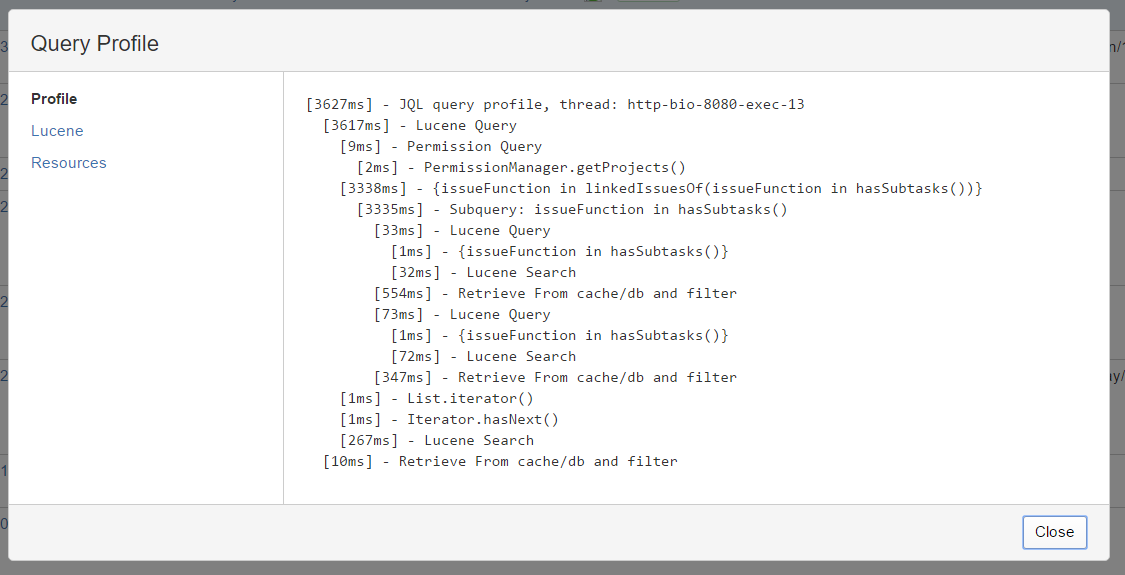
Clicking the Profile button may produce something like this.
We can see that the largest component in the time taken was the linkedIssuesOf clause. Time taken for this function is approximately proportional to the number of issues selected by the first argument. Did we really need to find linked issues of every issue that has subtasks? Perhaps we could narrow down that subquery further… let’s say we are only interested in the linked issues of issues in the SALES project with subtasks.
Modifying the query shows that we speeded things up from 3.2 seconds to less than 0.1 second:
Operations that took close to zero time are filtered out, to make it more readable. This, and other optimizations, explains why you may not get the same results if you re-run the profiler for the same query.
The other tabs provide technical information that you may or may not find useful.


