
Execution History
Use the Execution History page to analyse the effects of ScriptRunner scripts on your Jira instance. You can use Execution History to view execution times and failure rates for Script Listeners, Scheduled Jobs, Escalation Services and Post Functions scripts in your instance, allowing a long-term view of script performance.
The Execution History page allows you to view an analysis of all your script executions for Script Listeners, Scheduled Jobs, Escalation Services and Post Functions in a single page.
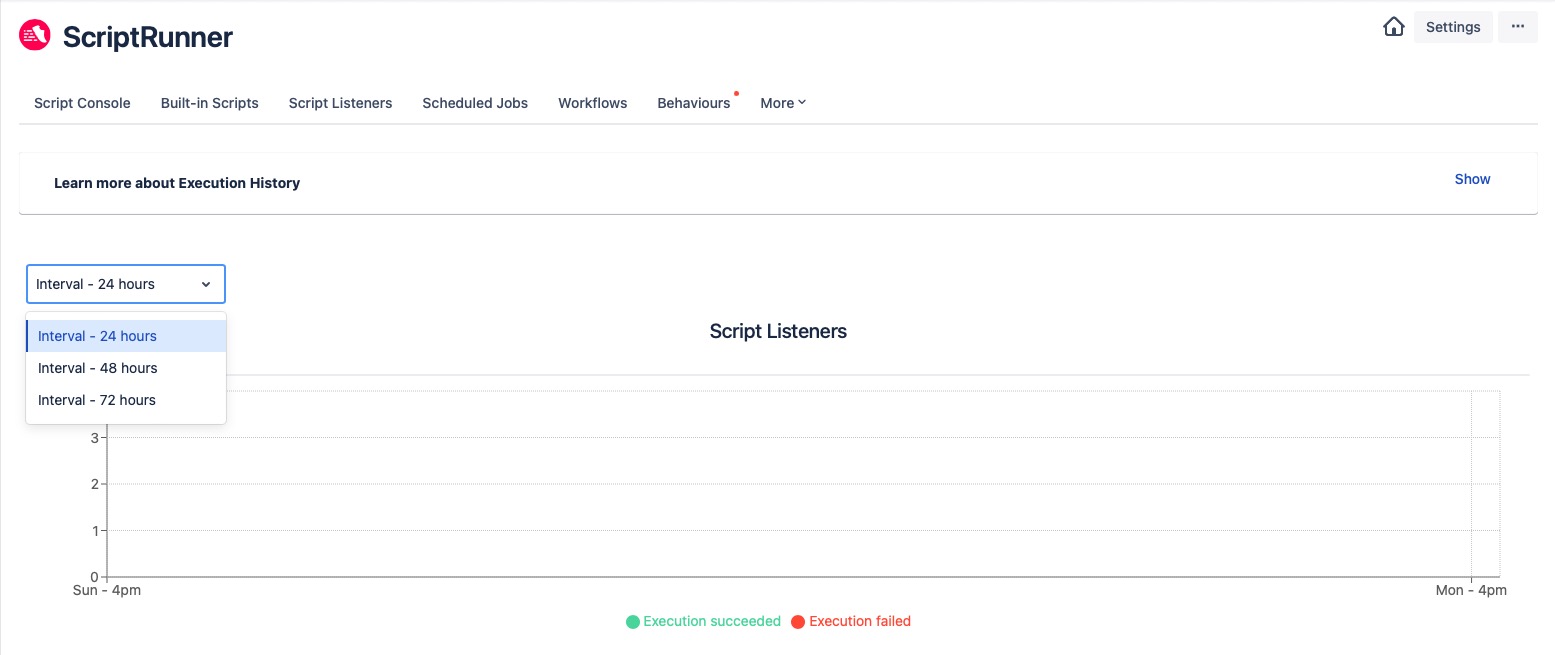
Click the Execution History option from the ScriptRunner menu and select the time frame you are interested in by choosing one of the options from the Interval drop down list that includes:
- 24 hours
- 48 hours, or
- 72 hours
Once loaded, you can view the script executions that have occurred in the chosen time frame as either a graph or a table, as shown below.
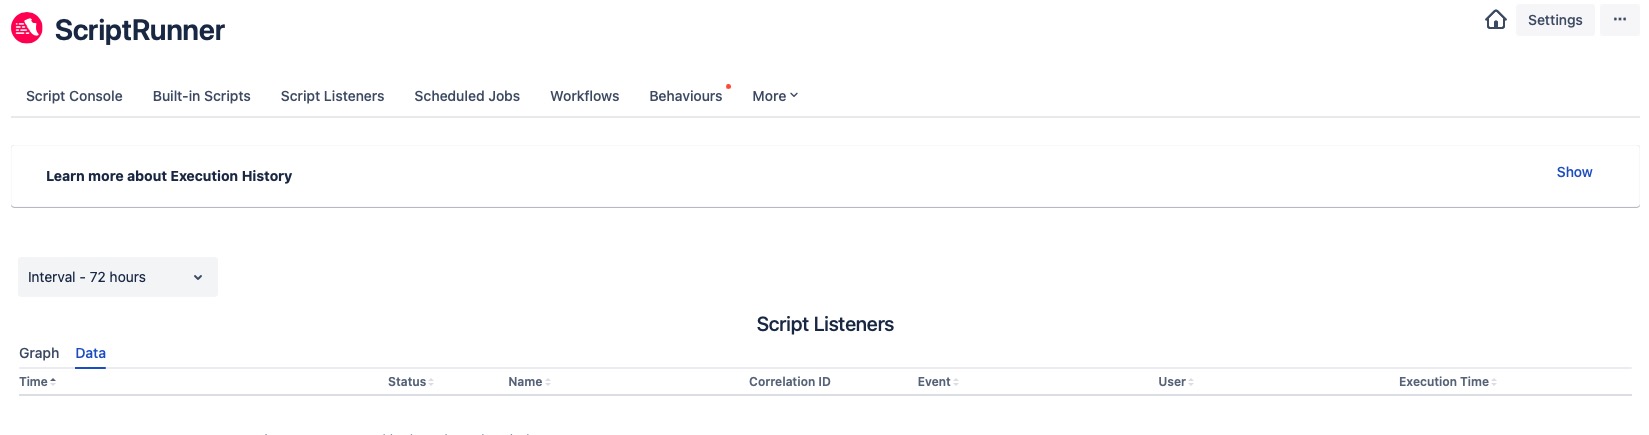
You can toggle between the Graph and Data results for each of the script executions. You should note that:
- The graph view shows whether or not a script executed successfully.
- Hovering over each bar in the graph view displays the time run and a description of the script.
- A more detailed analysis of the execution history of each script is provided in the table view, as shown below.
An Execution History table can include:
date of execution
execution status
name
correlation id
time to execute
issue
executor name
execution event
workflow name
initial workflow state
transition type
number of issues run against