Script Logs
Use Script Logs to view the logs for your latest lambda executions.
Navigation
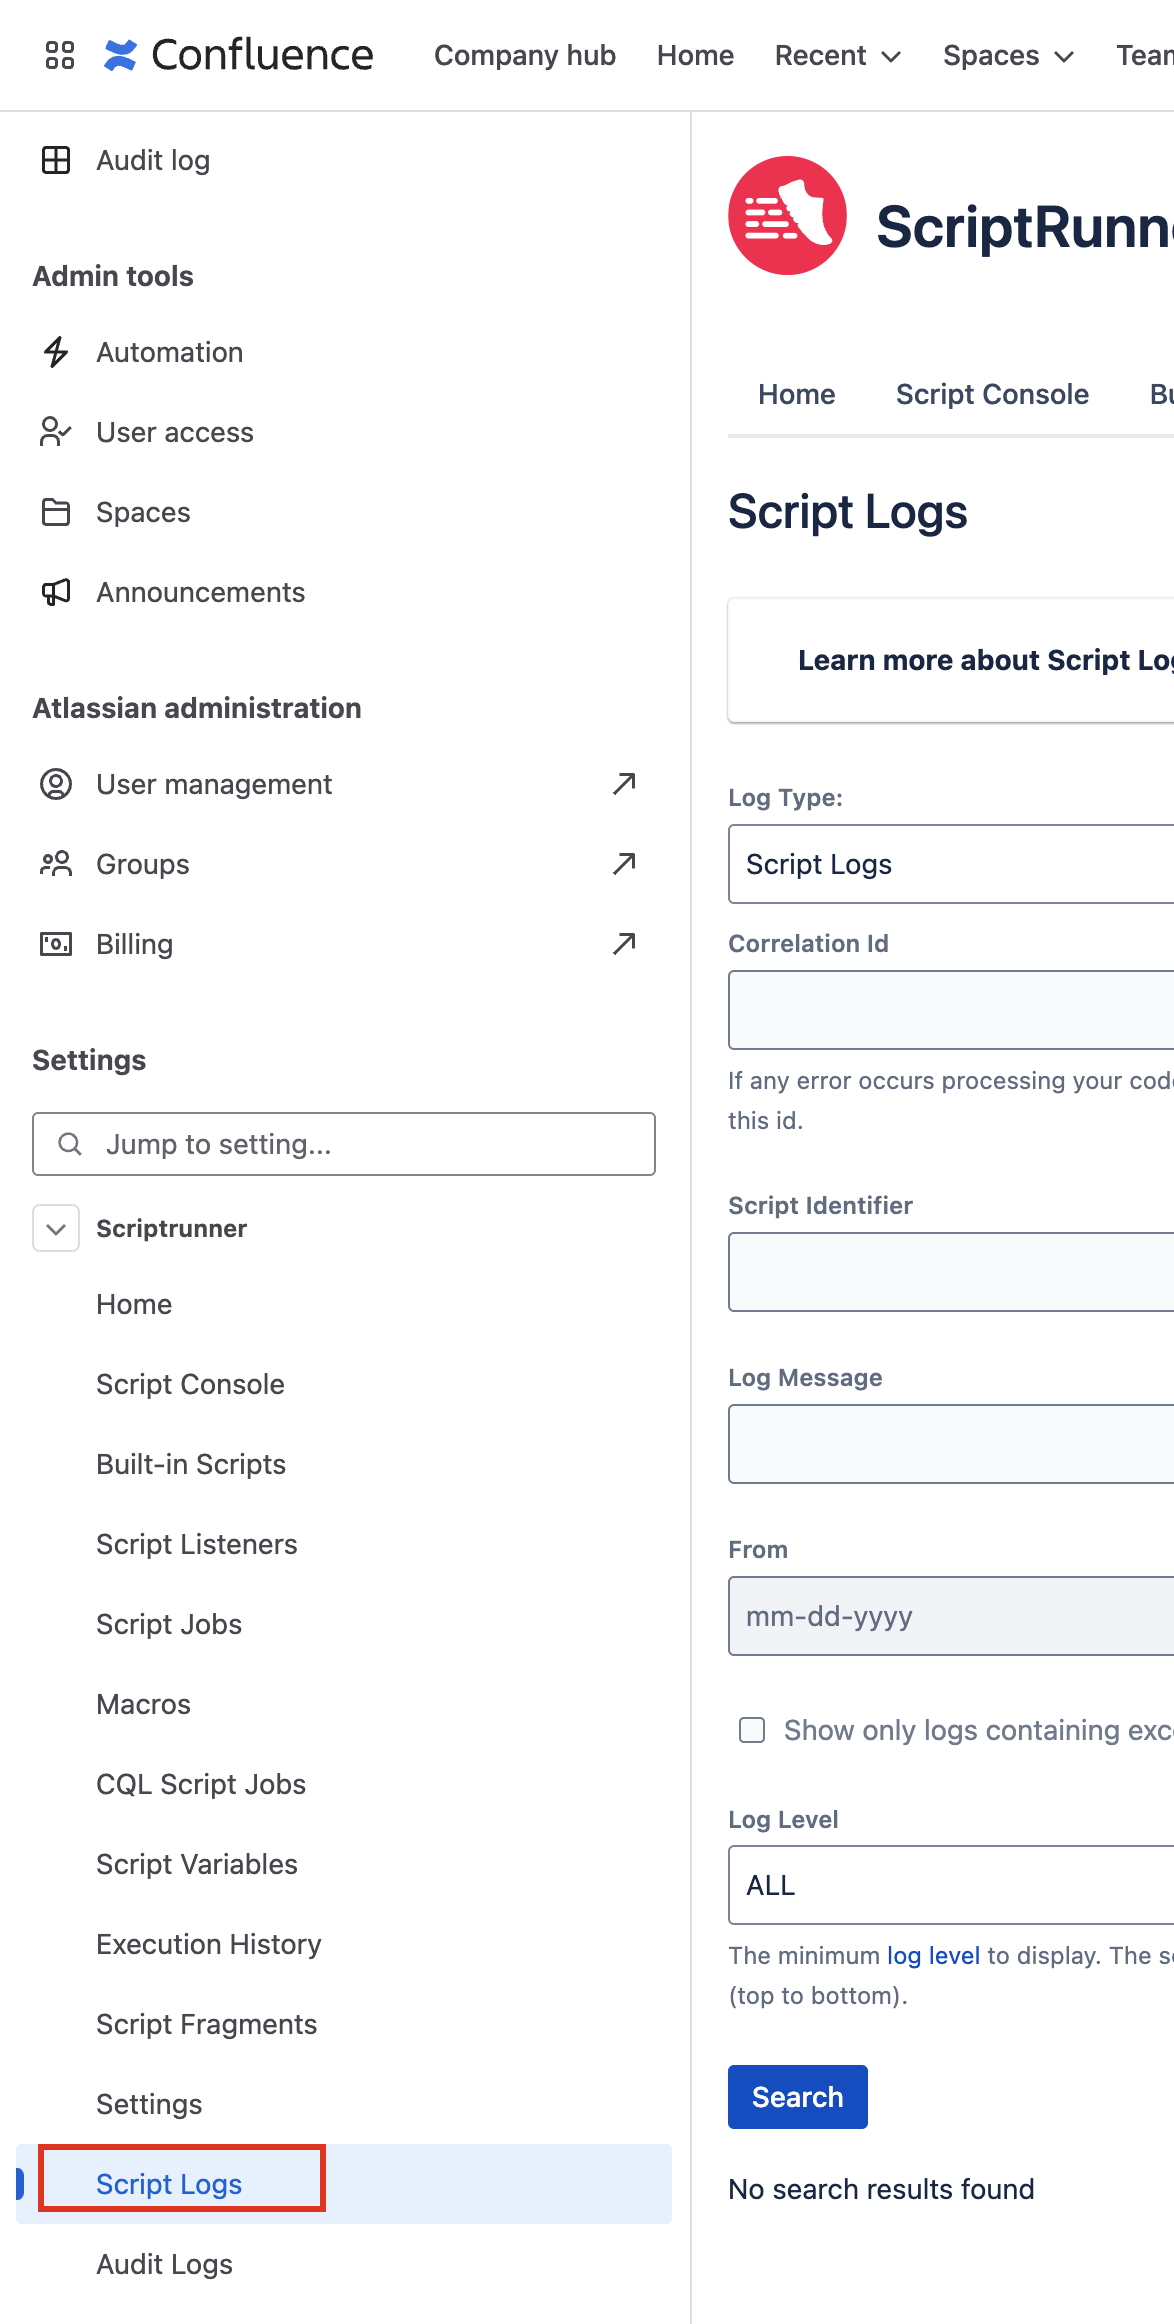
Navigate to Script Logs using the ScriptRunner menu in Settings:
Use script logs
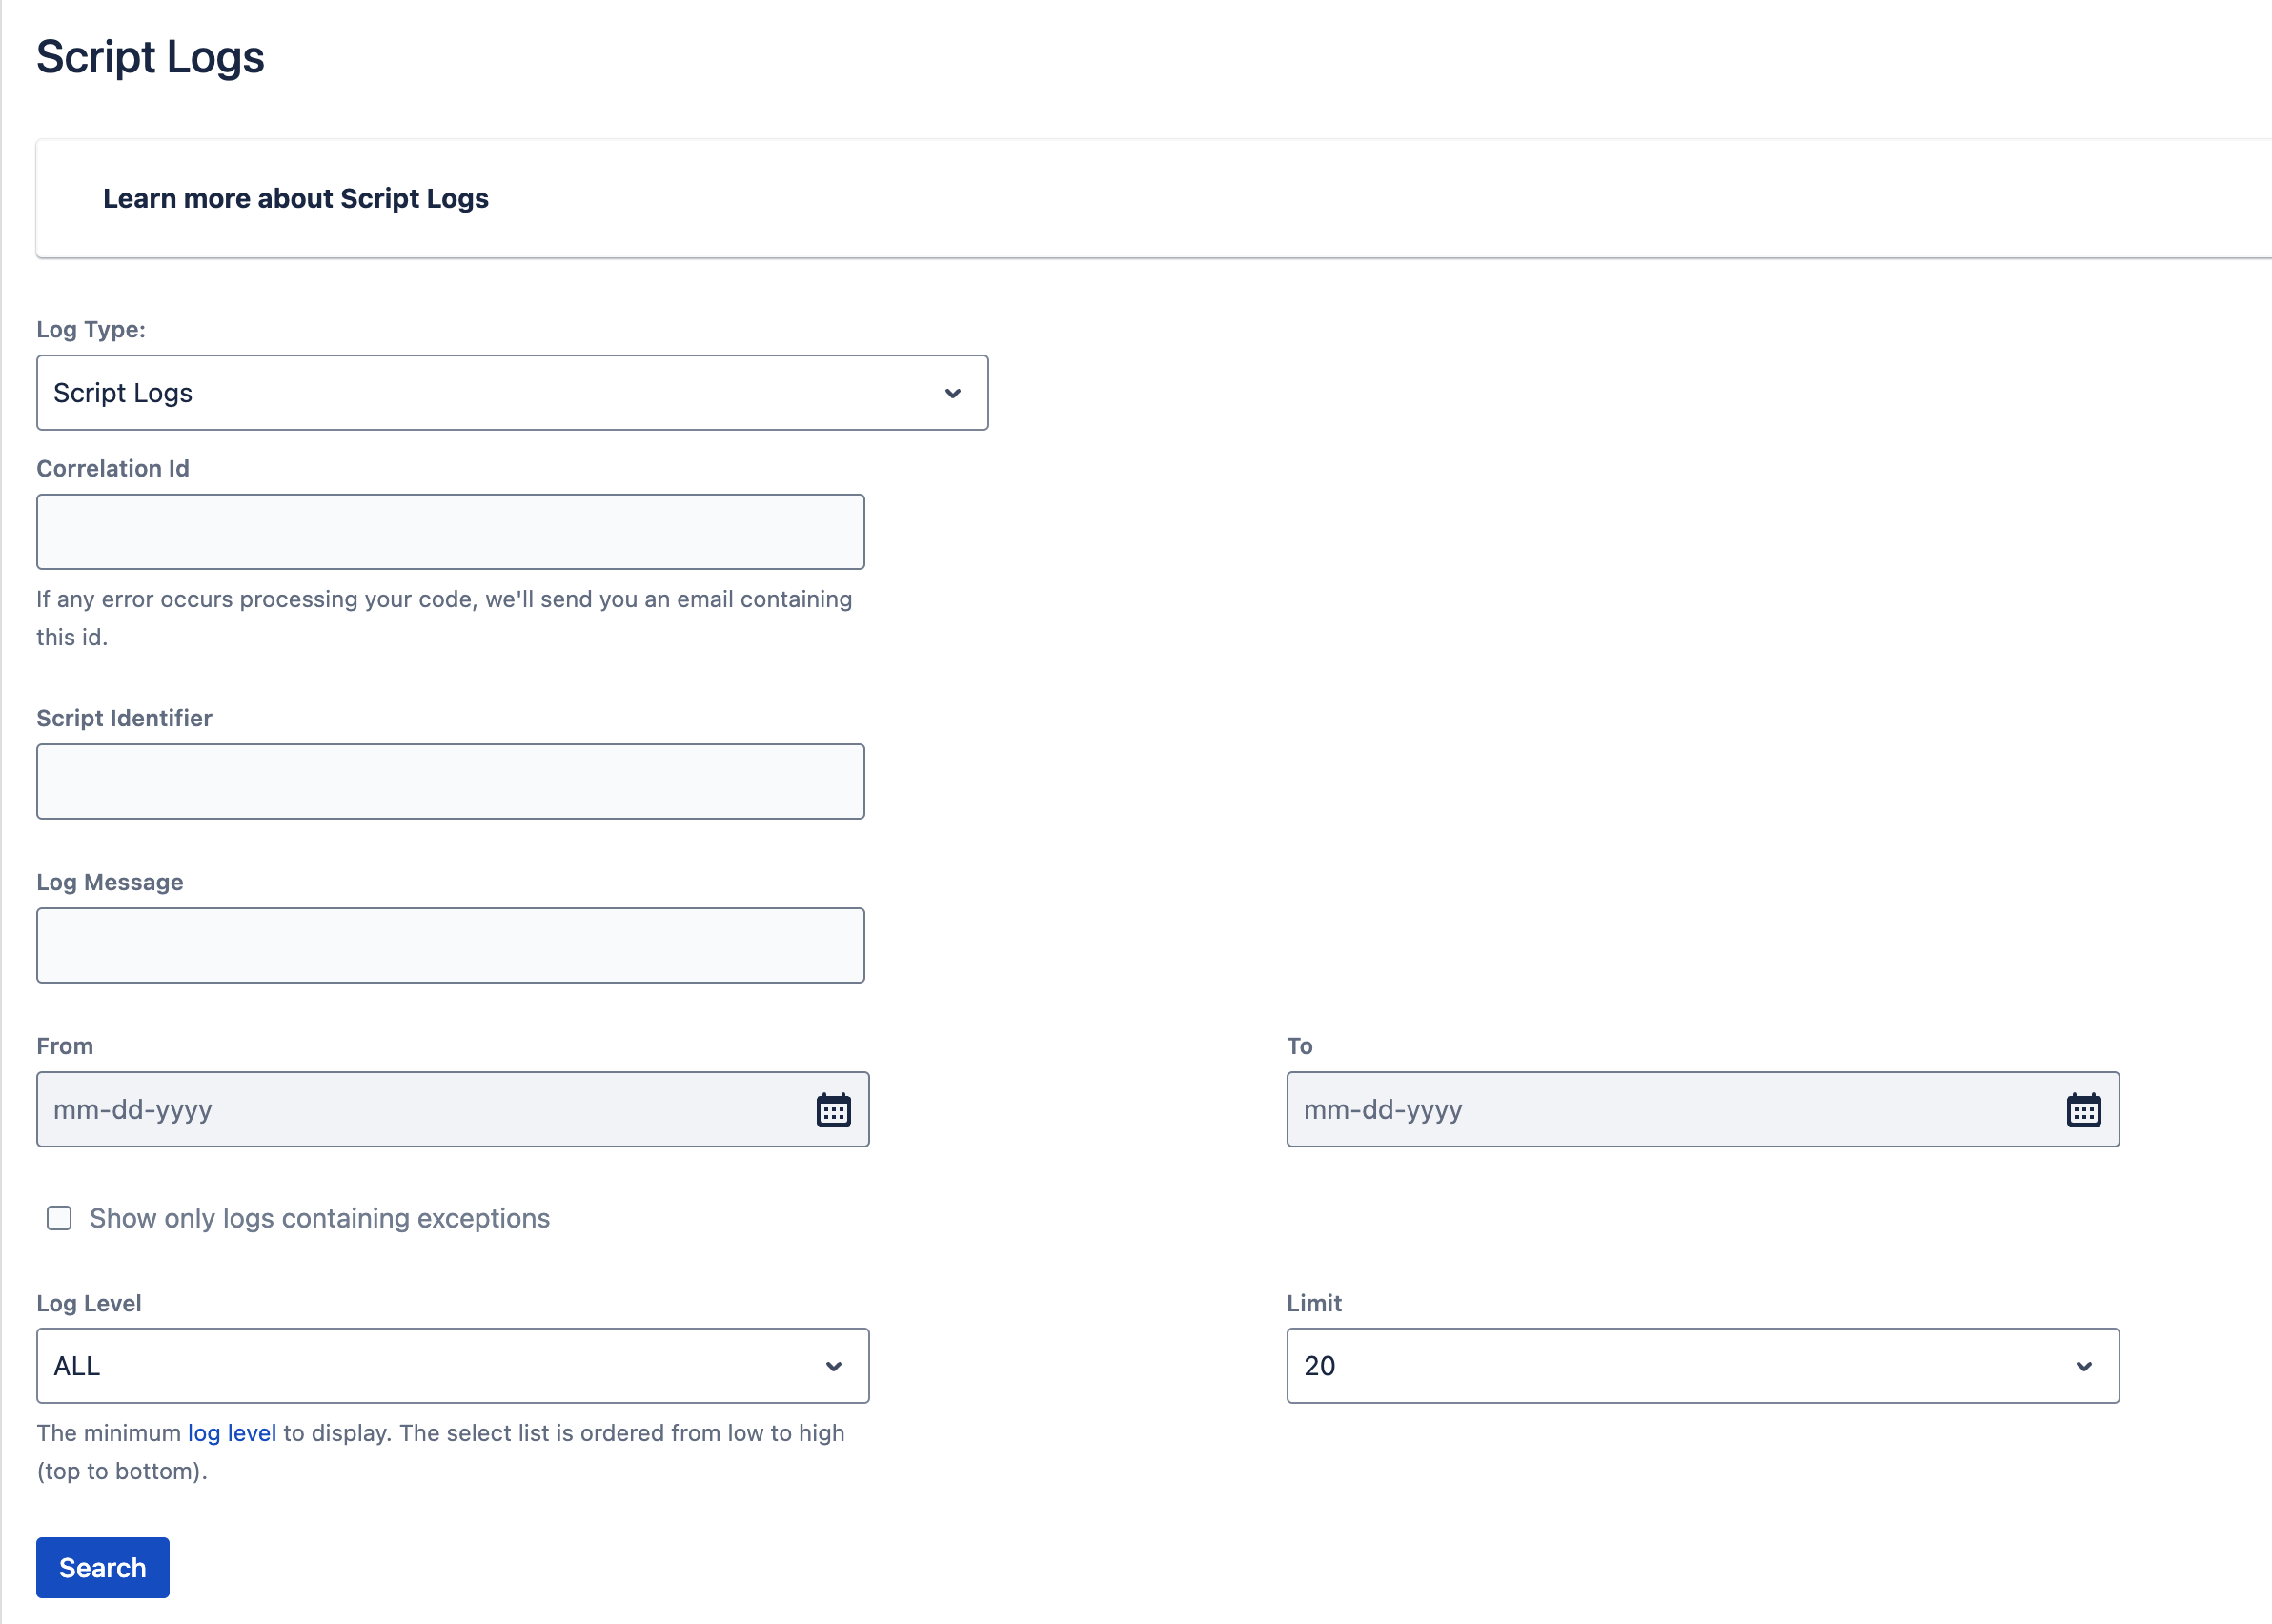
Once you navigate to the feature, you can search for the most recent logs generated by your scripts. Field explanations follow:
Correlation ID: View the script logs for one particular script execution.
Each time a script fails, the notifications group defined in Settings receive a script error notification email containing a Correlation ID unique to each execution of a given script.
Script Identifier: View all script logs across many executions for a given script.
Log Message: Find script logs that contain a specific word or text.
From and To Date: Search for script logs between specific points in time.
- Log Level: Select the minimum log level to display. Your options are:
- ERROR: Receive the following types of logs in your report:
error - WARN: Receive the following types of logs in your report:
errorandwarn - INFO: Receive the following types of logs in your report:
error,warn, andinfo - ALL: Receive the following types of logs in your report: All levels
- ERROR: Receive the following types of logs in your report:
Limit: Use to return more script log results.
The following image is how the Script Log form appears:
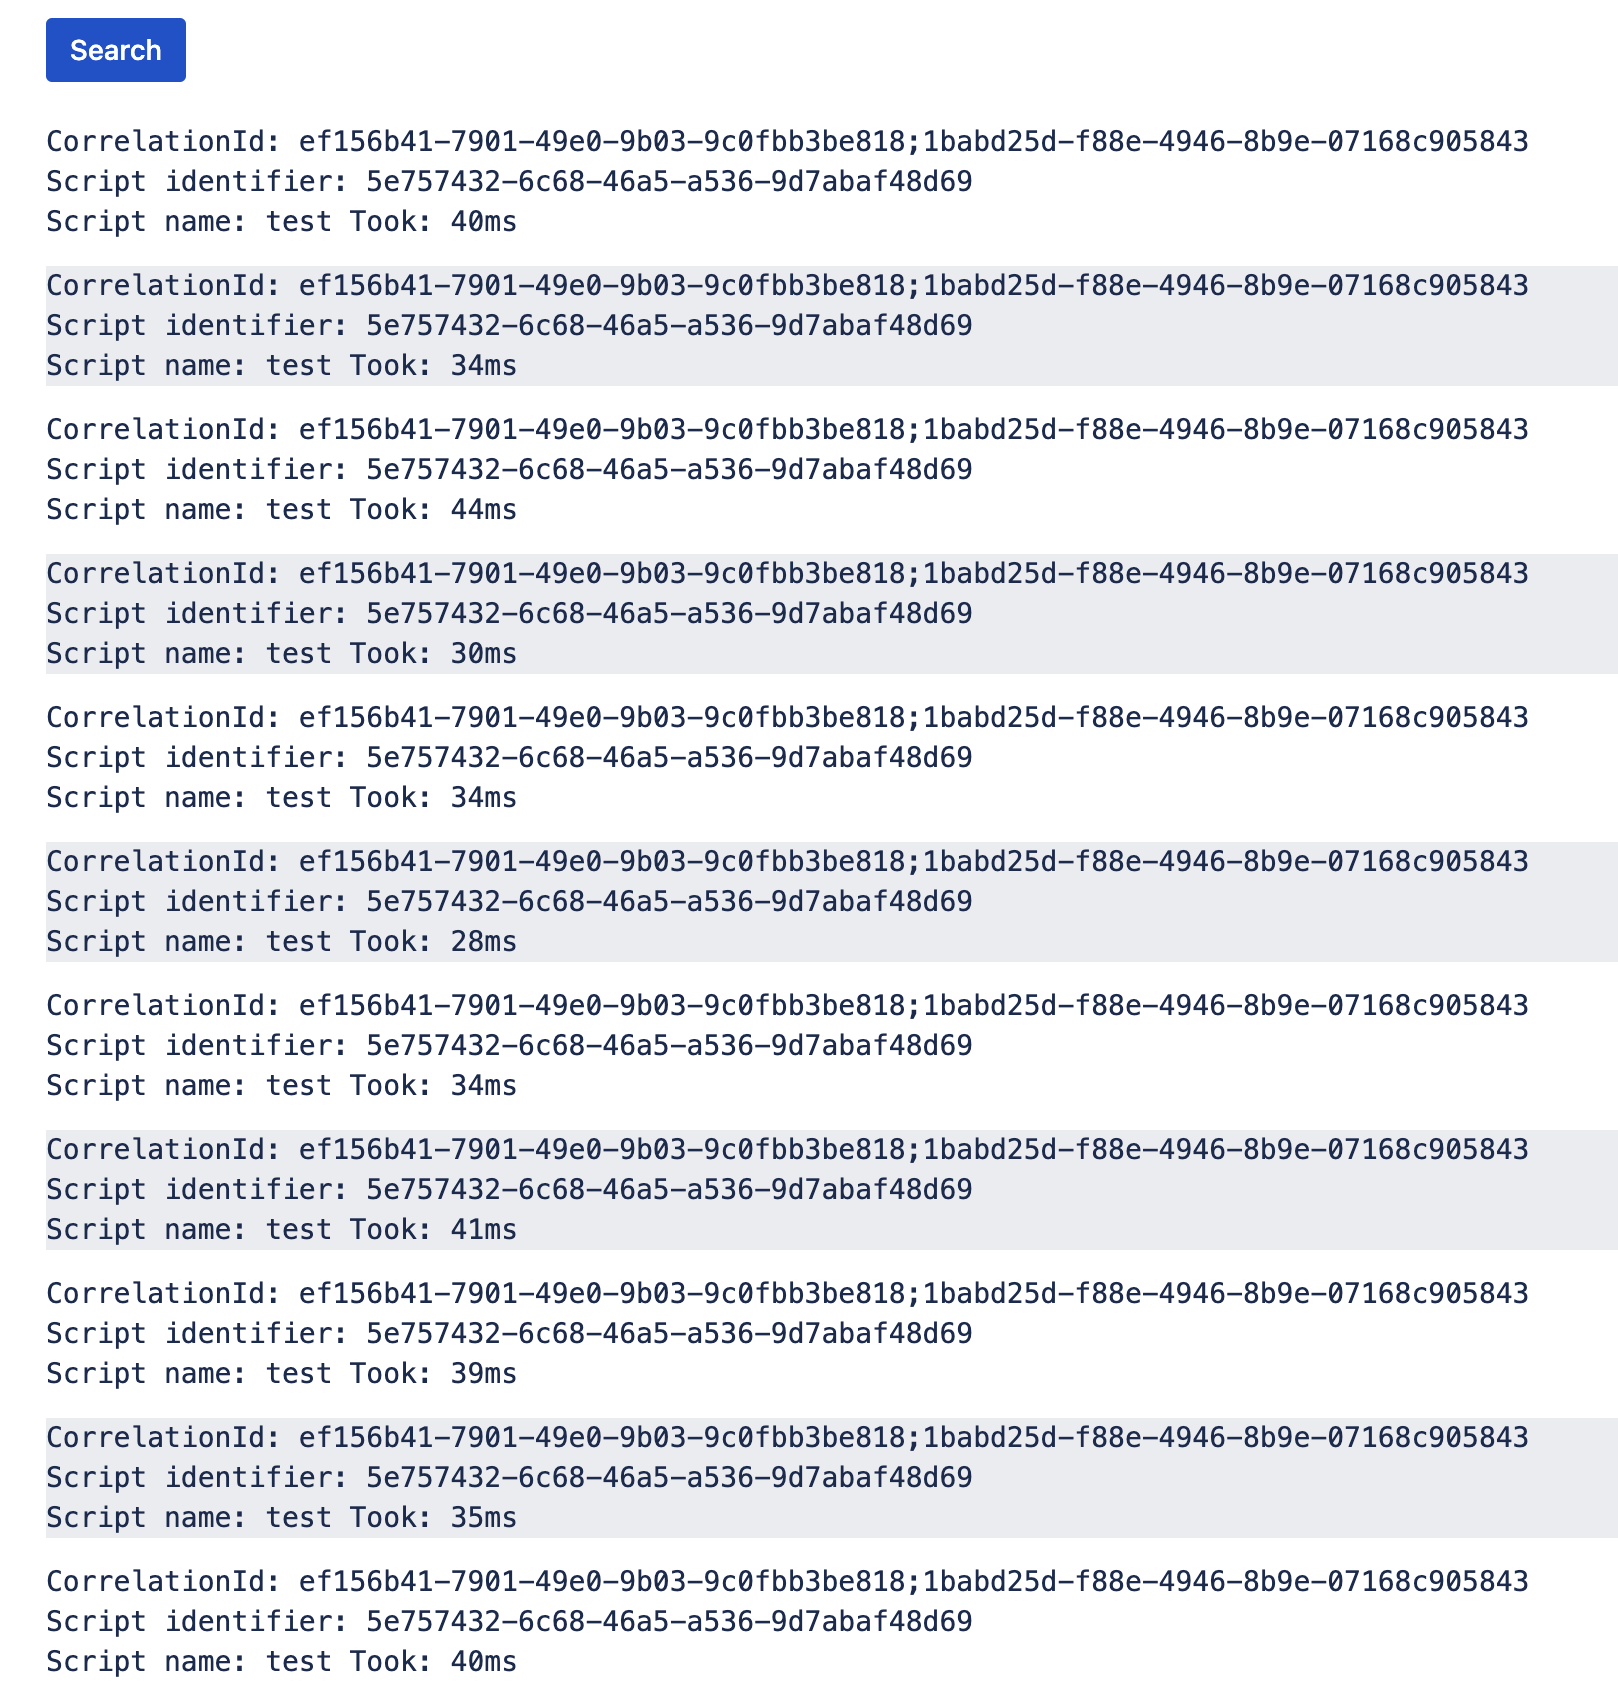
The following image is an example of the log results:


