
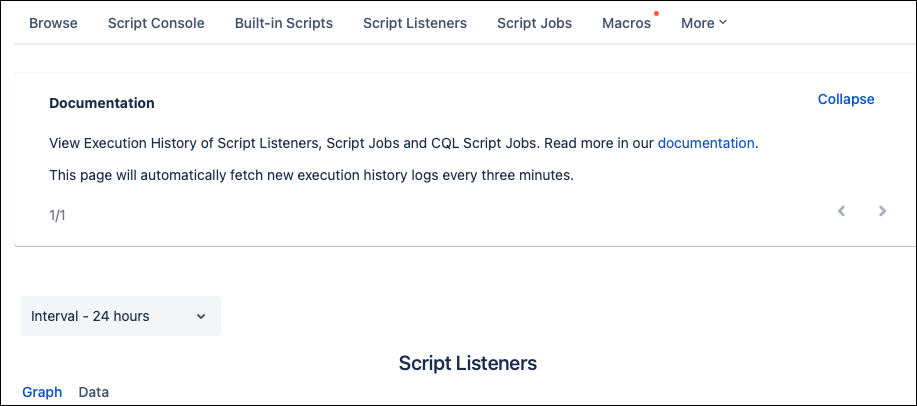
Execution History
Execution history allows you to view all of your script executions in a single page, presented as either a graph or data table. Viewable executions include built-in scripts, script listeners, script jobs, and CQL script jobs.
To navigate to execution history, select the ellipses menu in the top right corner of any ScriptRunner for Confluence Cloud Screen.

To select if you would like to view the information in a graph or data table, select it on the Execution History page.
View execution history as a graph
The graph shows if the script was executed successfully or if it failed.
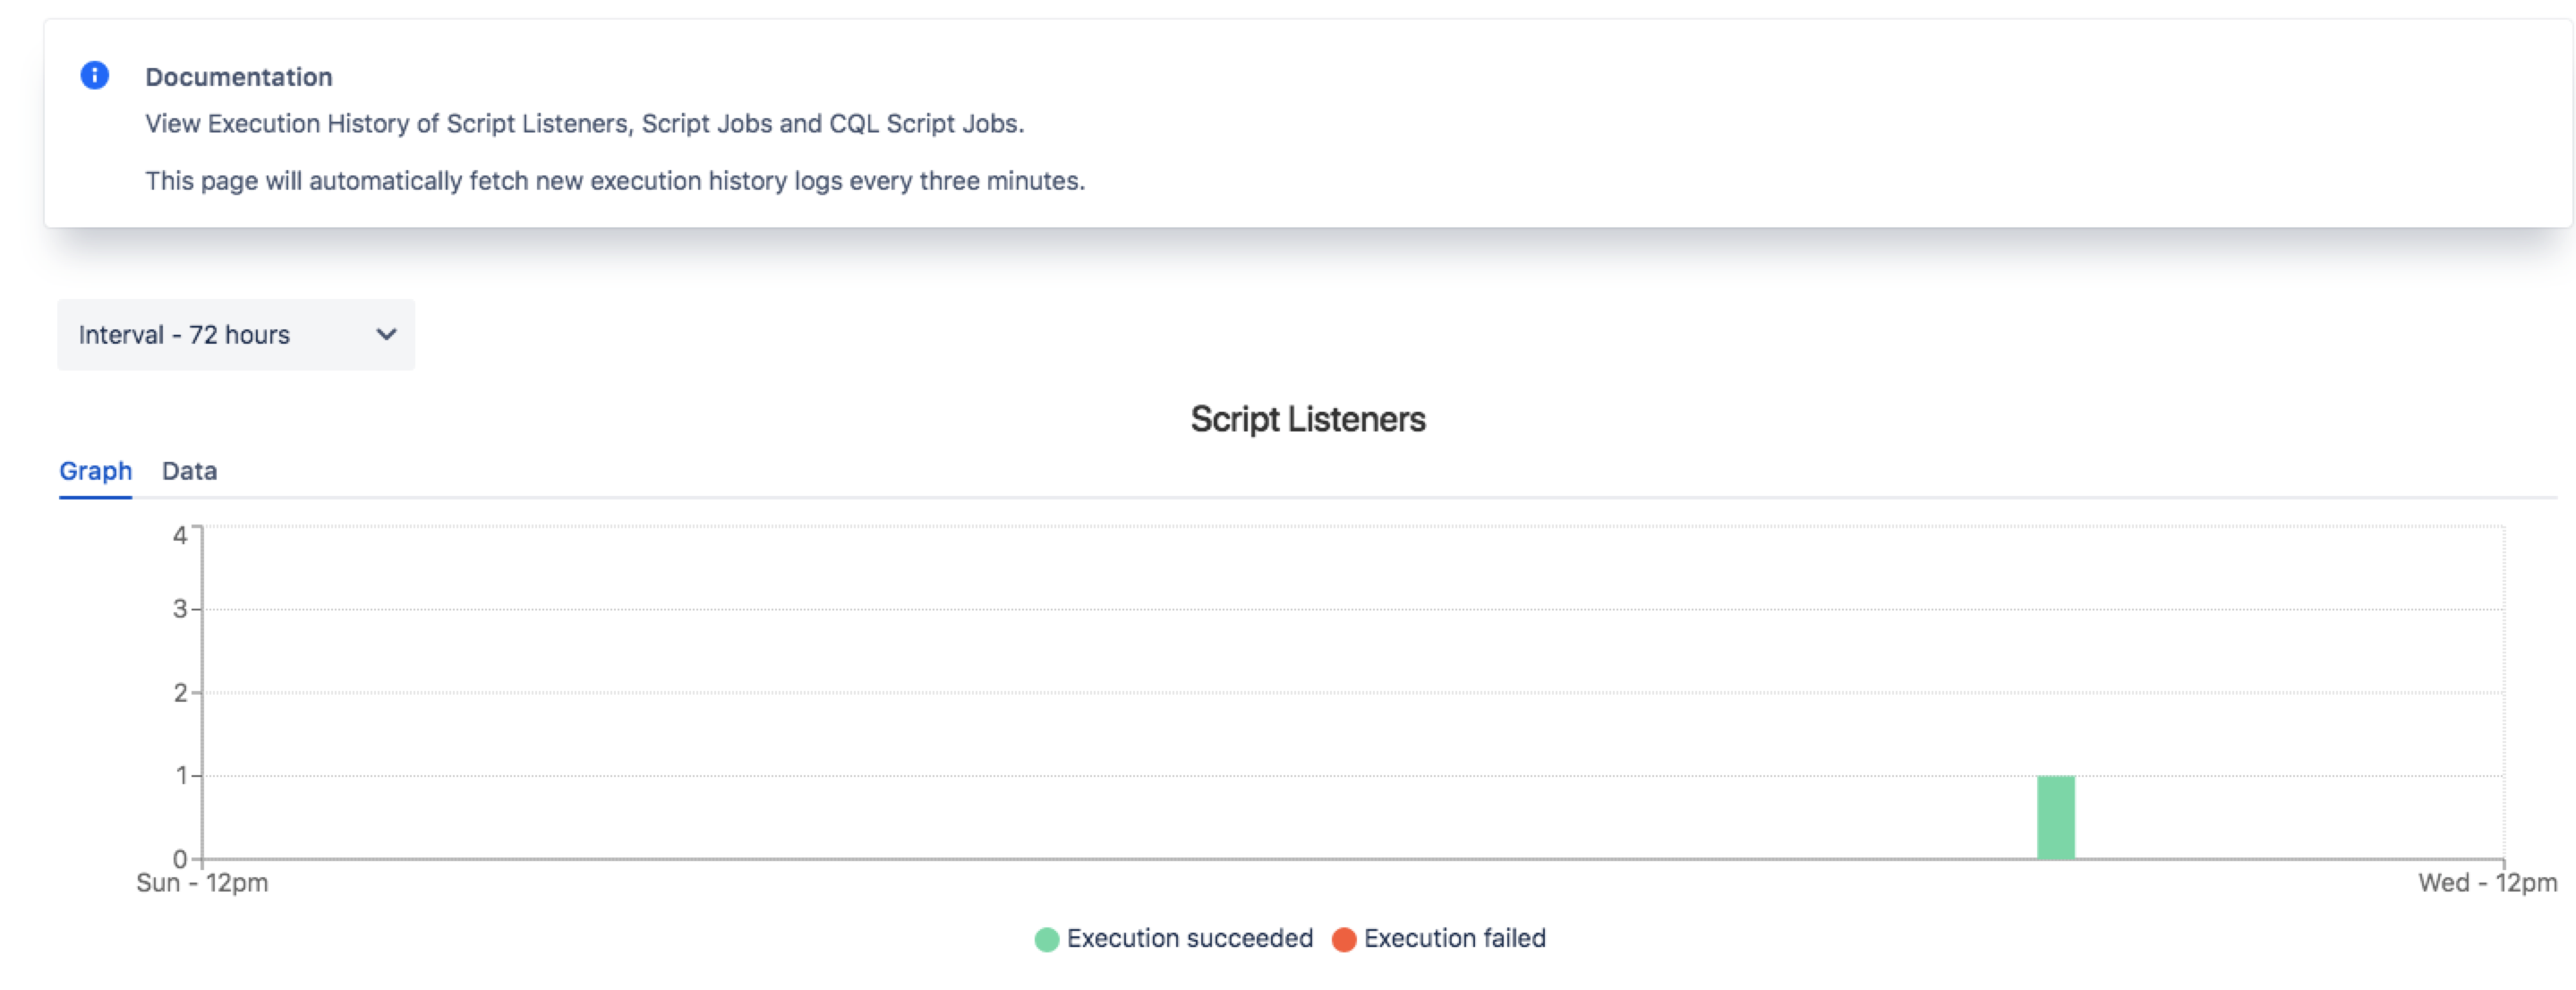
By hovering over the bar, you can see a tooltip that displays the following:
- Time run
- Description of the script
All histories displayed are from the previous 24 hour period and in graph view each segment represents a 30 minute block.
View execution history as a table
Viewing execution history in table mode provides a more detailed analysis of the execution history of each script.
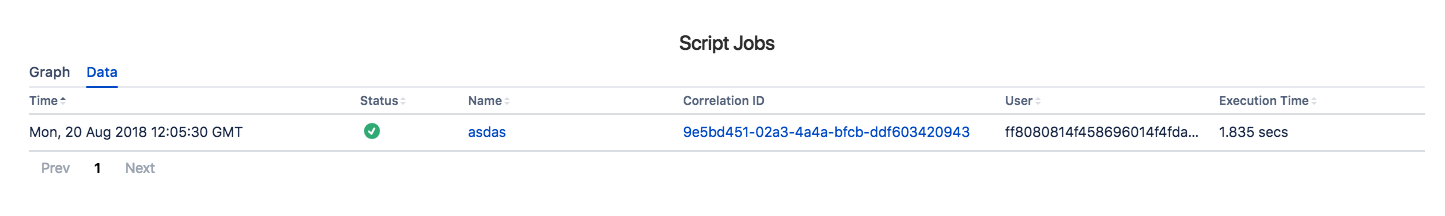
The table includes the following information:
Date of execution
Execution status
Name
Correlation id
Time to execute
Issue
Executor name
Execution event
Workflow name
Initial workflow state
Transition type
Number of issues run against