
Insights Dashboard
You can use the Insights dashboard page to get instant access to critical insights on your Jira instance. These insights can help when making plans to review your migration strategy or clean up your instance and enable you to audit your Jira instance by drilling down into helpful metrics that provide useful, accurate information.
To use Microscope Insights, follow these steps:
- Navigate to Microscope in the sidebar.
- Select Insights.

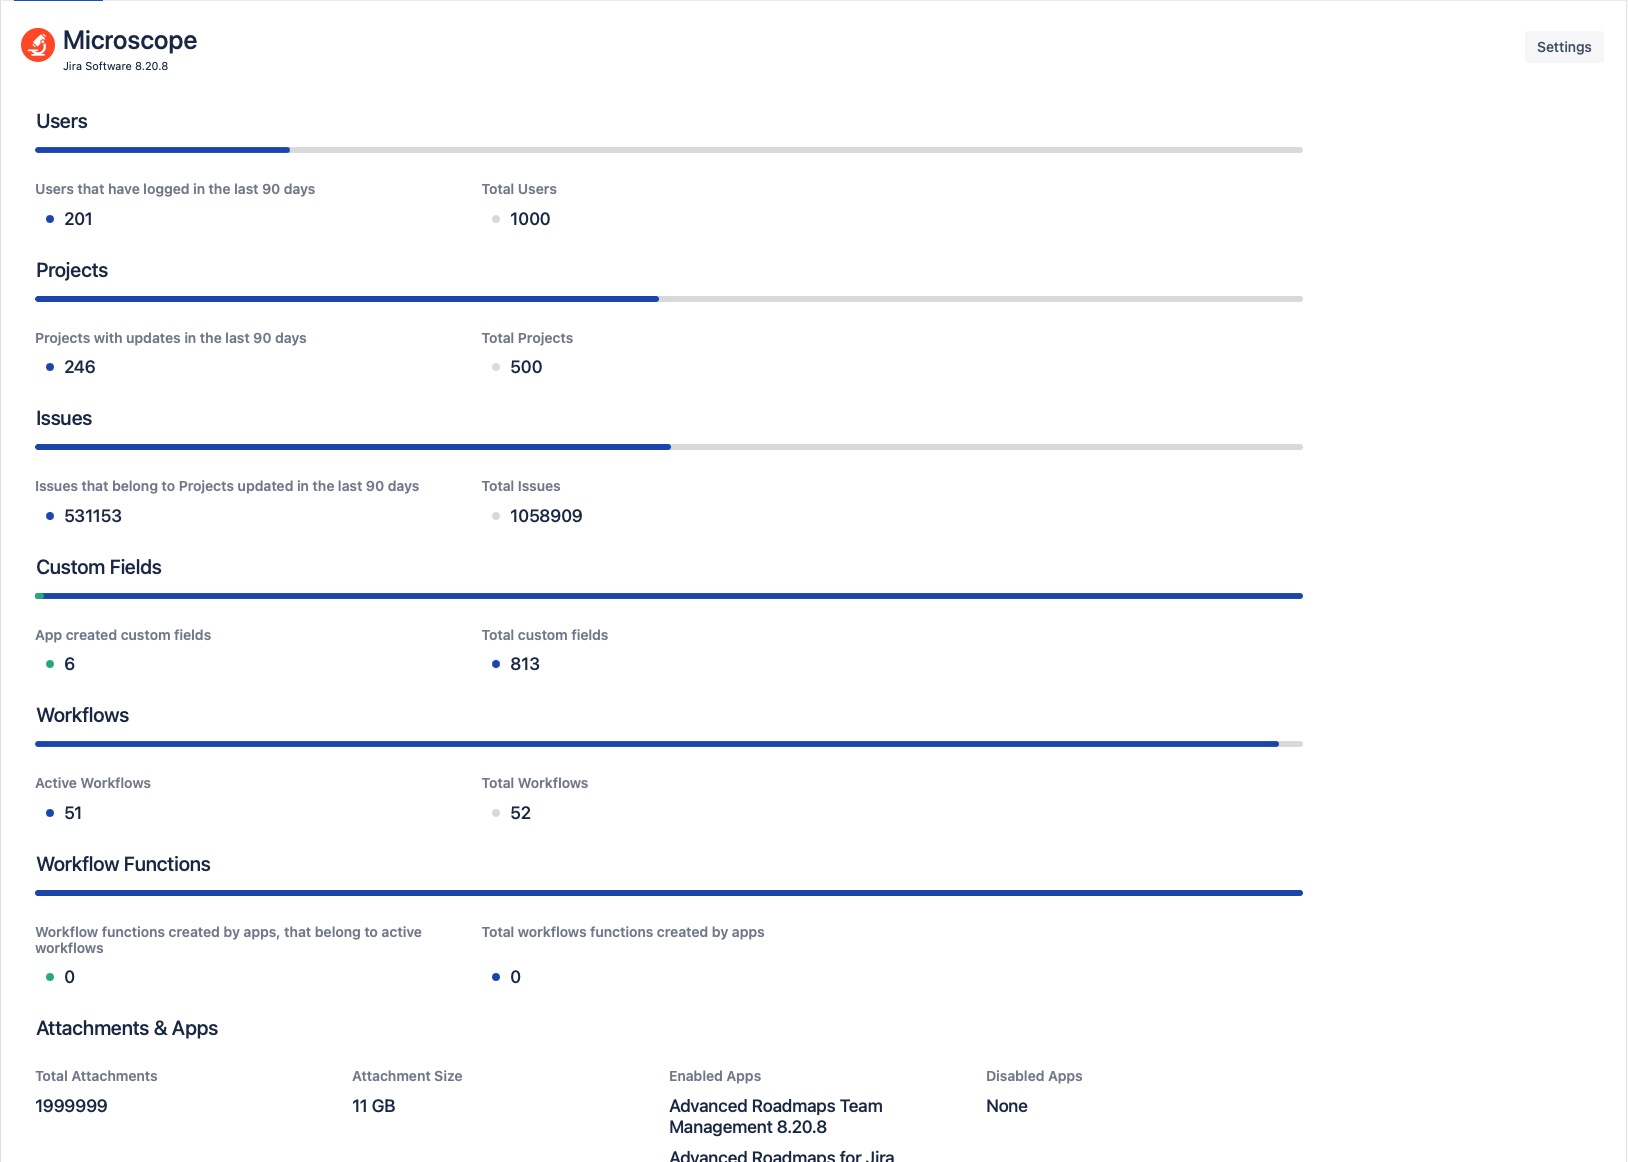
View the details of the report metrics that have been generated for your instance, as shown in the example below:
You can click the Settings button in the top right corner of the page to enable or disable Anonymous Analytics.
The Insights page provides the following analyses:Name Description Users View how many of your users are active against the backdrop of all users within the system. Active users are those that have logged in within the last 90 days. Projects Identify which of your projects receive regular contributions. A project is considered active if it has one or more issues that have been opened or updated within the last 90 days. Issues Streamline your searches by reducing the workload. Here we illustrate how many issues, contained within projects, are actually active. Workflows Gain direct access to metrics about how many of your workflows are active. A workflow is active when it is associated with at least one project. Workflow Functions View how many workflow functions were created by apps and are associated with active workflows. Custom Fields Build an understanding of your custom fields, distinguishing those created by apps. Attachments & Apps Get a rundown of the quantity and size of attachments in your instance whilst being able to see apps that are enabled and disabled.